Urban trees play a vital role in improving city life—reducing heat, filtering air, capturing rainwater, and enhancing mental well-being. Yet in many cities, including Mexico City, trees are not treated as critical infrastructure. This article explores how the nonprofit Foresta is using high-resolution satellite data and open-source tools to map urban tree cover, identify inequalities, and prioritize areas most in need of reforestation. The findings reveal not only environmental insights, but also social disparities—and how data can drive more equitable climate resilience.
MELI HARVEY
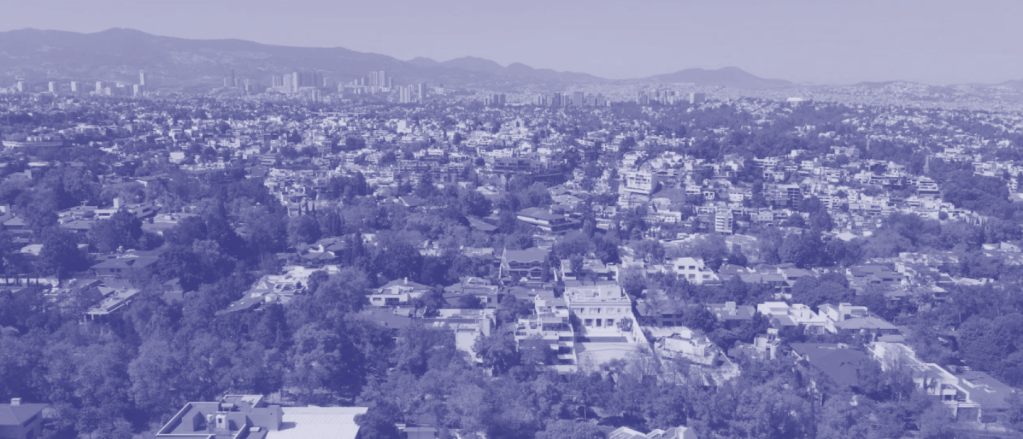
THE URBAN FOREST
Urban trees can have some significant benefits for the health and comfort of urban inhabitants. For instance, trees can:
- reduce high temperatures associated with the urban heat island effect
- absorb air pollutants like CO2, SO2, and NOx
- capture harmful particulate matter so human don’t breath it in
- reduce noise pollution and it’s negative health impacts
- provide shade, promoting walking and outdoor activities
- aid in capturing rainwater preventing stormwater overflow
- improve mental health through stress reduction properties of plants
So often, however, trees are not considered as a critical piece of infrastructure in our urban environments. Fortunately, there are organizations, like Foresta which are trying to change this. I’ve been working with them to map tree cover in order to chart the future of urban tree planting in Mexico City.
One of the first steps in any city mapping project is defining the city itself. Where does it begin and end? For Mexico City, the “mancha urbana,” or urban footprint, spreads well beyond its official boundaries. In the image below, the pink line outlines Ciudad de México (CDMX), while the purple line marks the broader mancha urbana, sourced from UNAM’s Áreas Urbanas dataset.
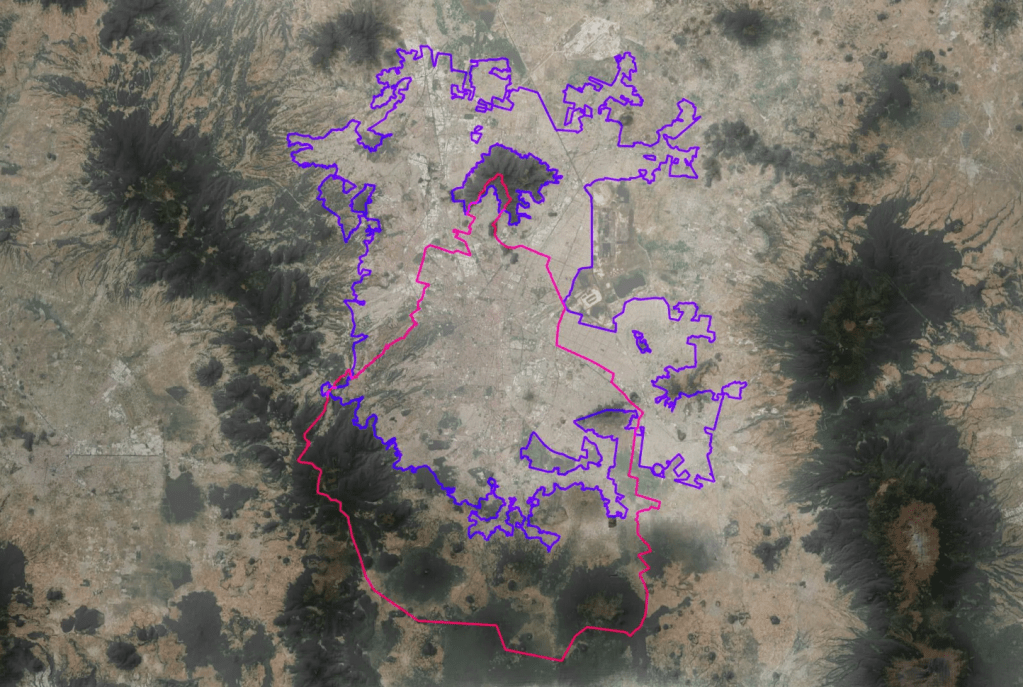
You can see that a significant portion of the city is located outside the city’s boundary in the surrounding state, Estado de México. The official boundary of CDMX also includes many rural areas, especially in the south. Using the mancha urbana ensures we are including the whole city and only measuring trees that are within urban areas.
So how does one measure tree cover in a city like Mexico City?
I started looking for datasets that would provide city-wide tree canopies. The Global Forest Change dataset from University of Maryland is widely used, but its too low resolution to capture urban street trees. After a long search, I was frustrated and on the verge of training an ML model to identify tree canopies from satellite imagery. That’s when a friend of mine alerted me to a new dataset by Meta AI Research and WRI called High Resolution Canopy Height Maps. This dataset was built using a Self Supervised Learning model on unlabeled aerial images. The canopy height predictor was built in top of this using LIDAR data as the ground truth. The resulting dataset has at a resolution of 1 meter, small enough to identify single street trees. Take a look at this comparison between the 2 datasets centered on a large park.
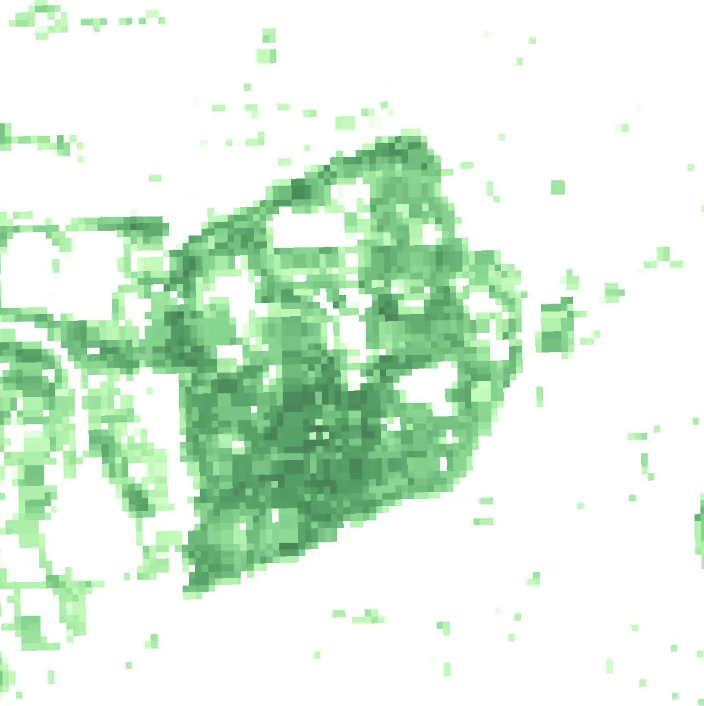
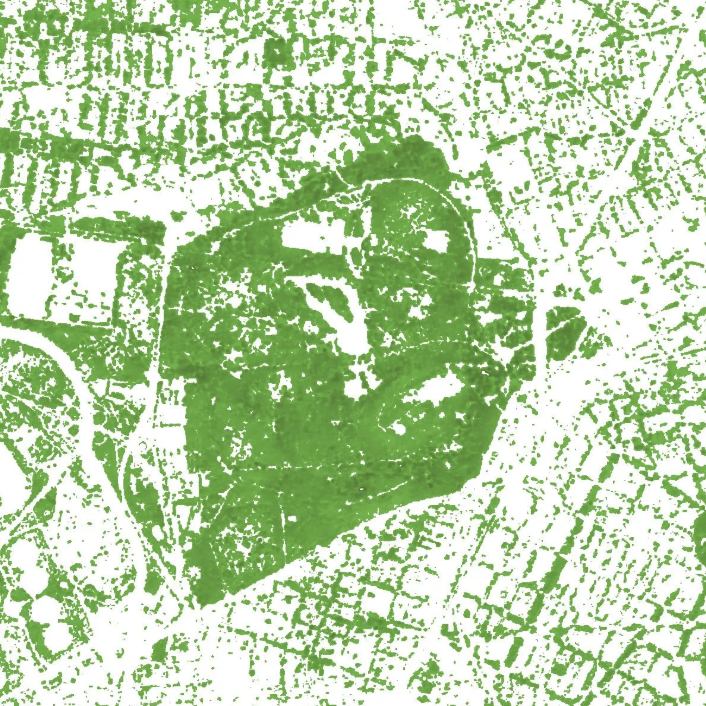
| Global Forest Change (UMD) | Canopy Heights (Meta) |
|---|
Both datasets capture trees in the park, but the Meta dataset clearly does a better job at capturing street trees in the surrounding neighborhoods. It’s actually quite impressive in its resolution and ability to distinguish between different vegetation types. Take a look at the Meta dataset across the whole city! The image below shows trees in green against a dark background to give some contrast.
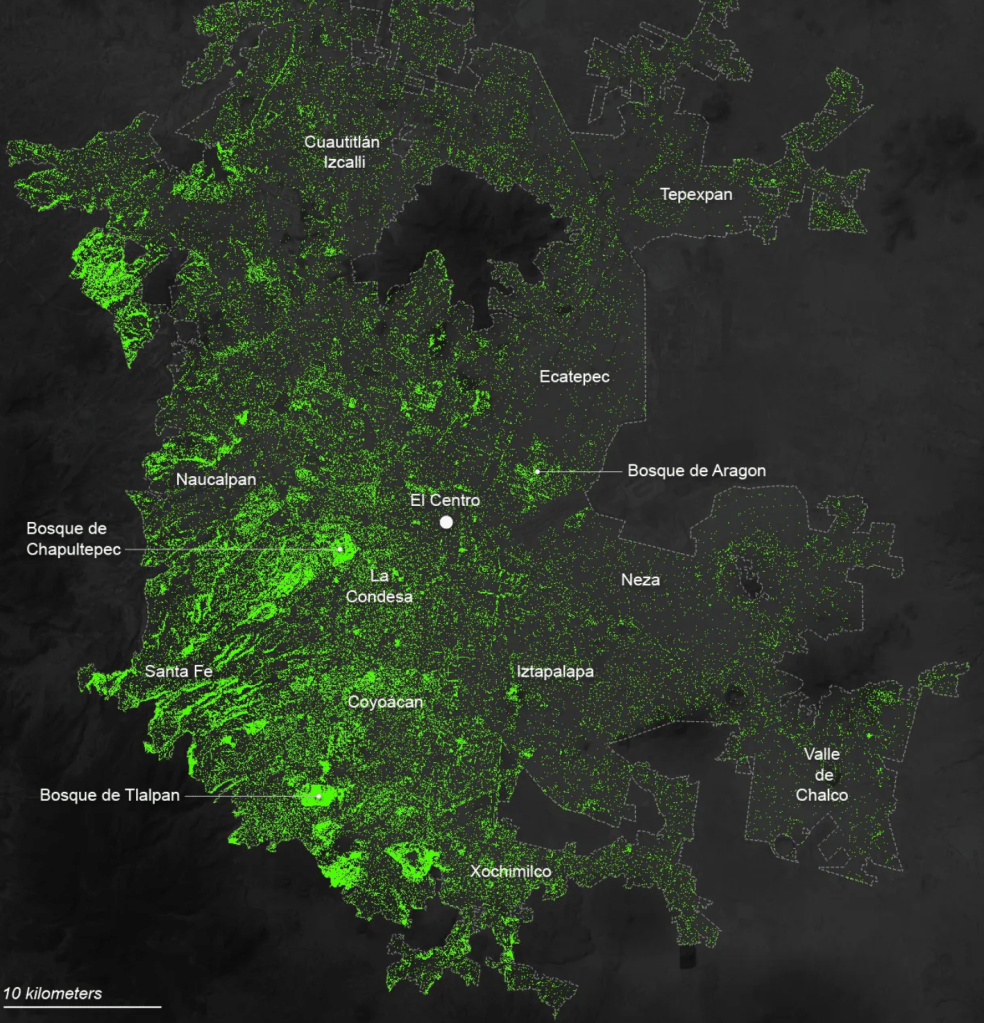
Looking at this image, one thing that immediately jumps out is that there are clearly more trees in the west of the city. Neighborhoods in the west, such as La Condesa, seem to have many more trees than those in the east, such as Neza and Ecatepec. Let’s take a look at what this looks like on the ground.
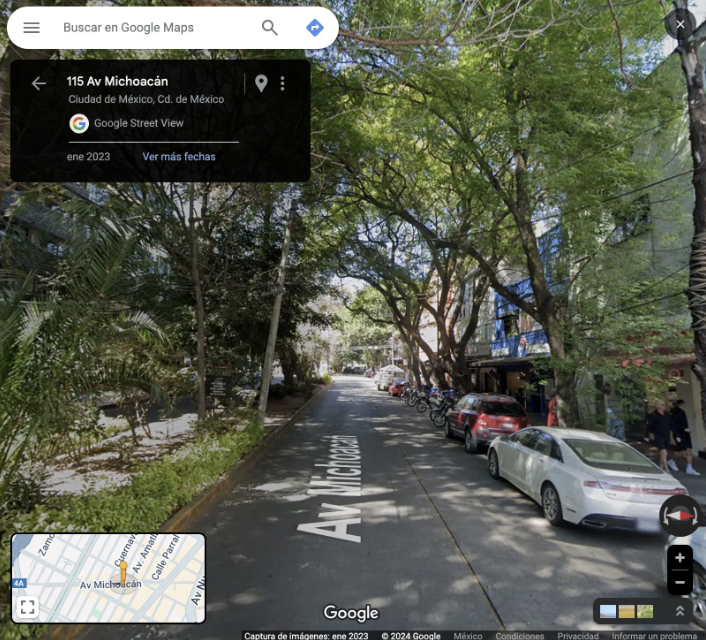
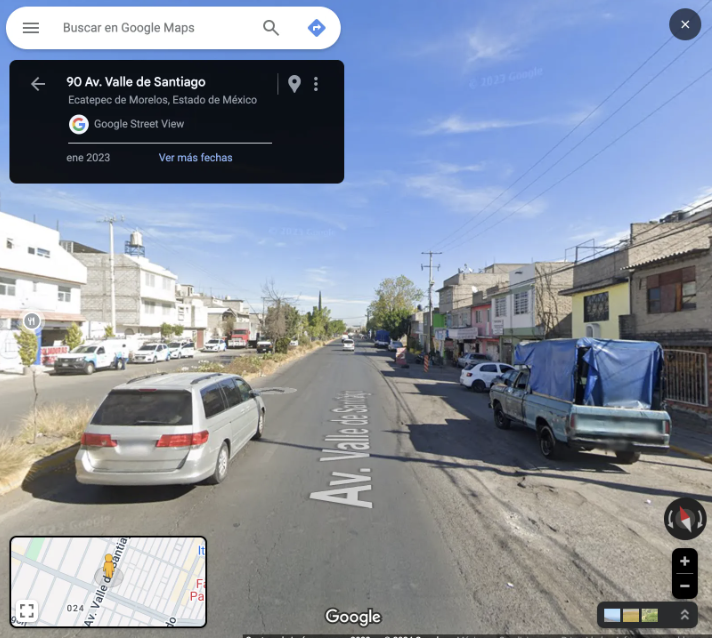
| La Condesa, CDMX | Ecatepec, Estado de Mexico |
|---|
These 2 neighborhoods clearly have different amounts of trees. So how can we get a quantitative measure of the the difference between these 2 neighborhoods?
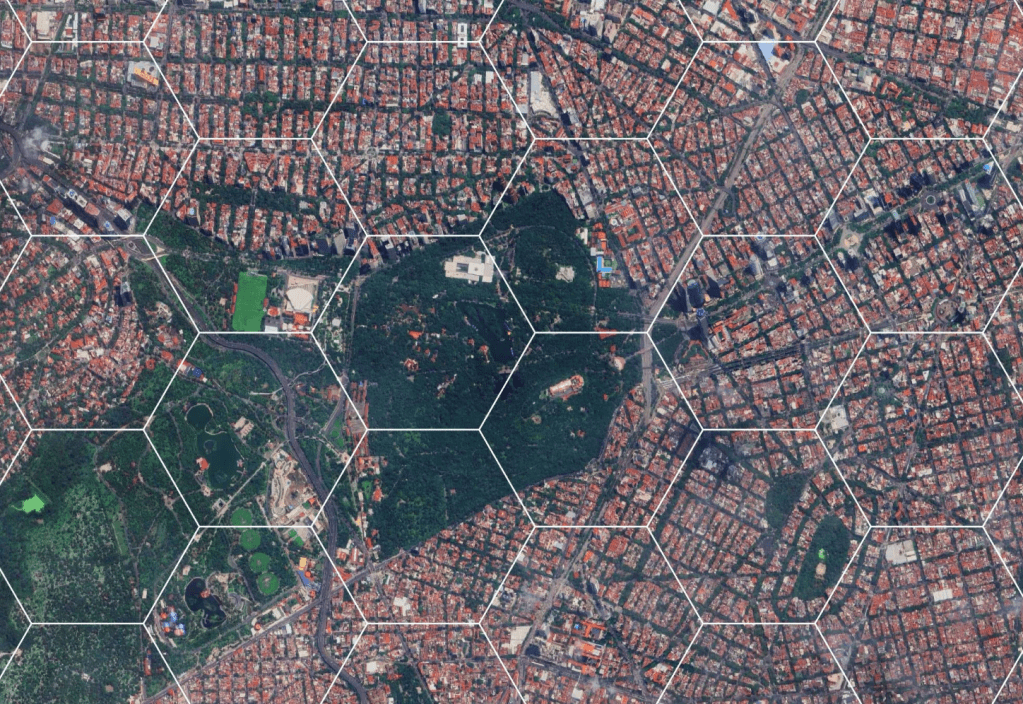
For this task, I used one of my favorite tools for obtaining neighborhood statistics: hexagonal bins. Aggregating data to hex bins has some benefits over other options like ZIP codes or census tracts (AGEB in Mexico). First of all, they are equal area, so you can compare them with needing to normalize values over area. You can also adjust the size of hex bins to approximate the size of your “scale of interest.” For this project, I chose hex bins that are 1000m wide. This is the size of a small neighborhood, or the area that an able bodied person can cover in 5 minutes starting from the center. The image below shows the hex bins overlaid on the same zone around Bosque de Chapultepec.
Next, I calculated the percentage of each hex bin that was covered by tree canopy. I didn’t consider the tree height, other than filtering out anything below a 1 meter height, which would remove smaller bushes and planters. Here are the results visualized for the entire mancha urbana.
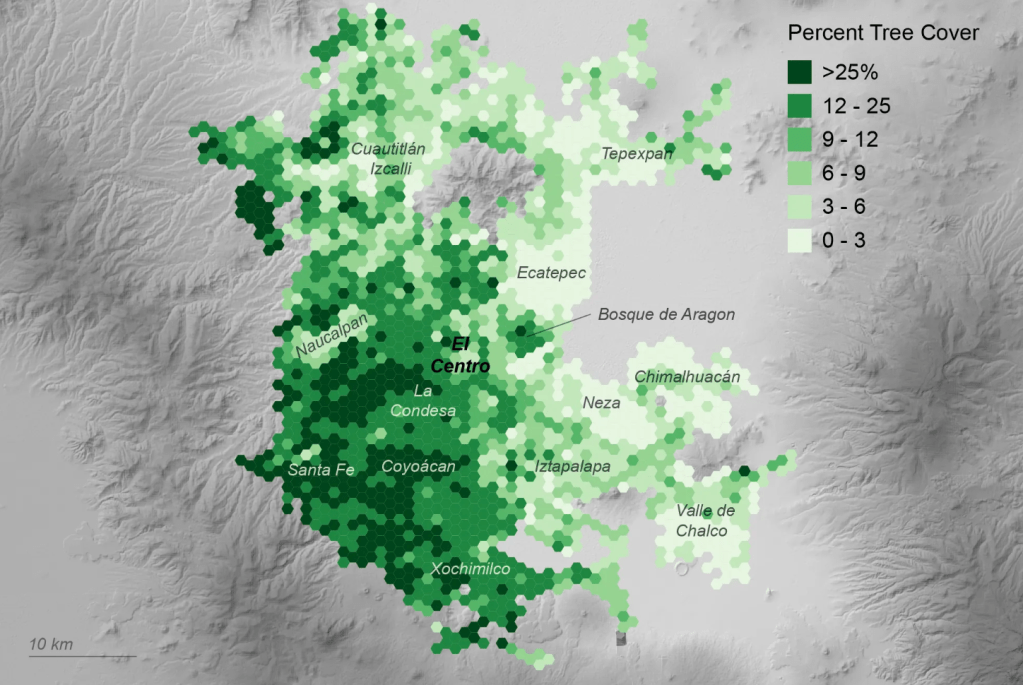
The binned results confirm the initial observation, which is that the west side of the city has more trees than the east. There are some notable exceptions. Naucalpan is on the west side, yet it has few trees. Likewise, Bosque de Aragon on the east has fairly high tree coverage.
What can explain tree canopy differences across the city?
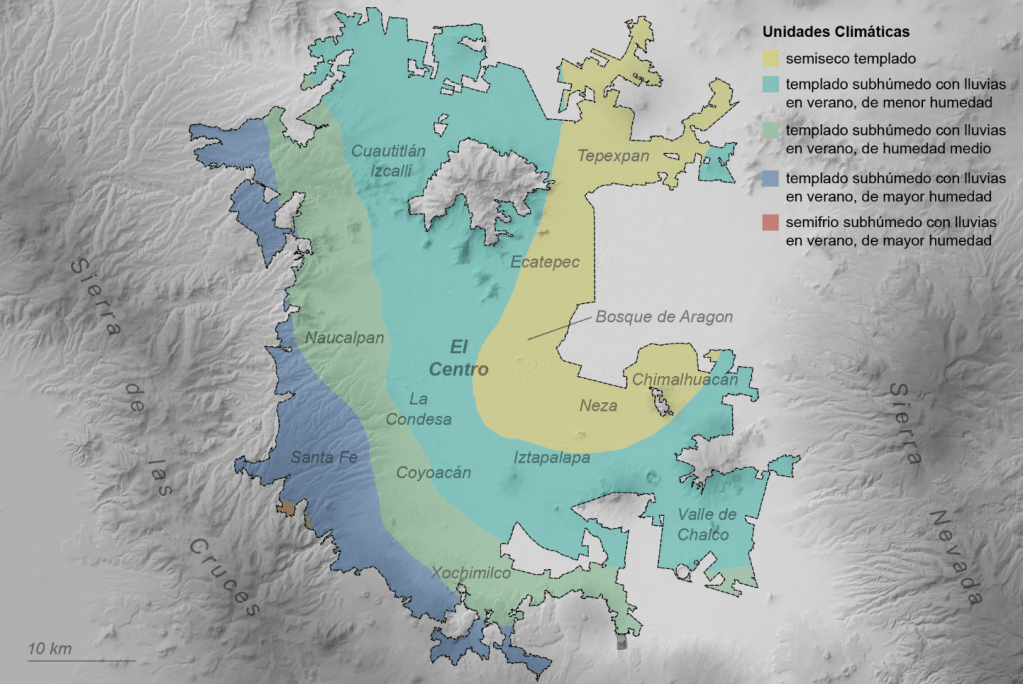
One possible explanation is that the west side of the city is on the slopes of the Sierra de las Cruces, a relatively moist mountain range. The eastern part of the city is more arid. In the image below, you can see pretty significant gradient in climate classifications from INEGI . This This gradient roughly matches the tree cover, with the dryest semi-arid zone in the east having the fewest trees.
The climatic factors likely influence much of the difference in tree cover across the city. However, these don’t mean trees can’t thrive in eastern parts of the city. Bosque de Aragon is a large park and adjacent neighborhood in the eastern part of the city that shows up as having high tree coverage. There are tree species that are able to thrive in the semi-arid climate, such as mesquites, cypress, and acacia. They offer a different quality to the environment they create. Below you can see the contrast between Bosque de Chapultepec in the west, and Bosque de Aragon in the east.
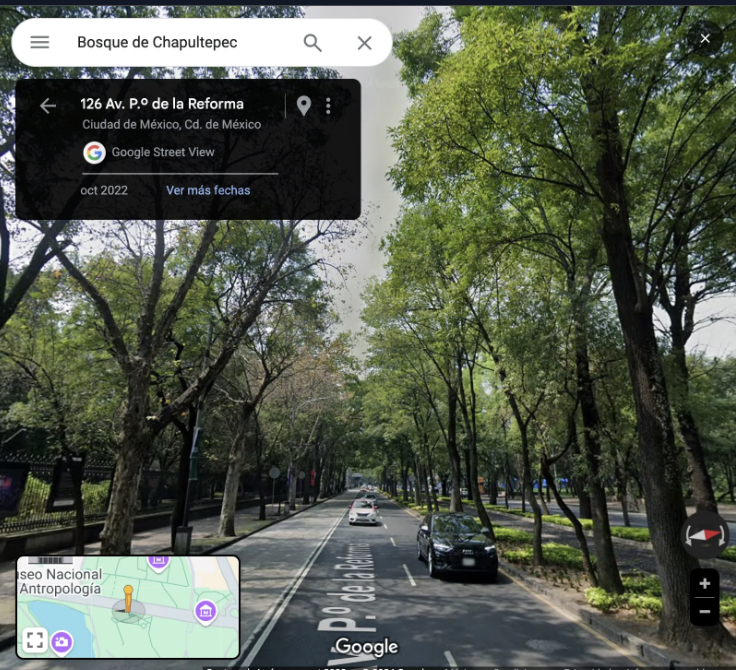
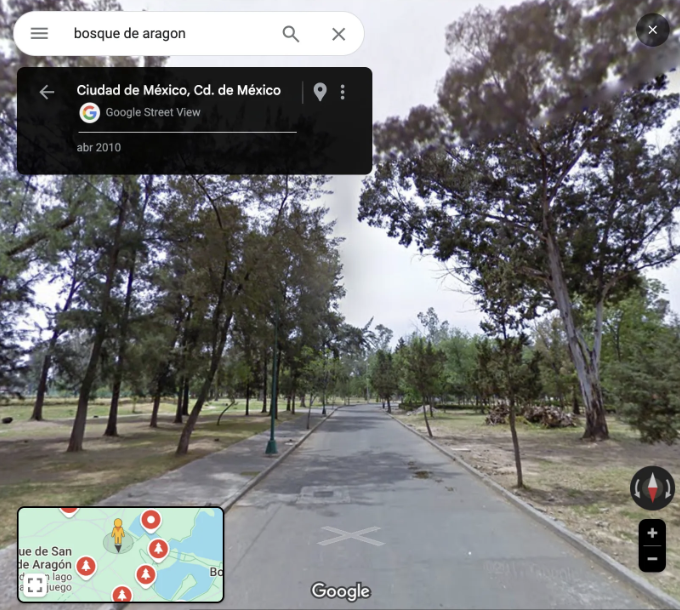
| Bosque de Chapultepec | Bosque de Aragon |
|---|
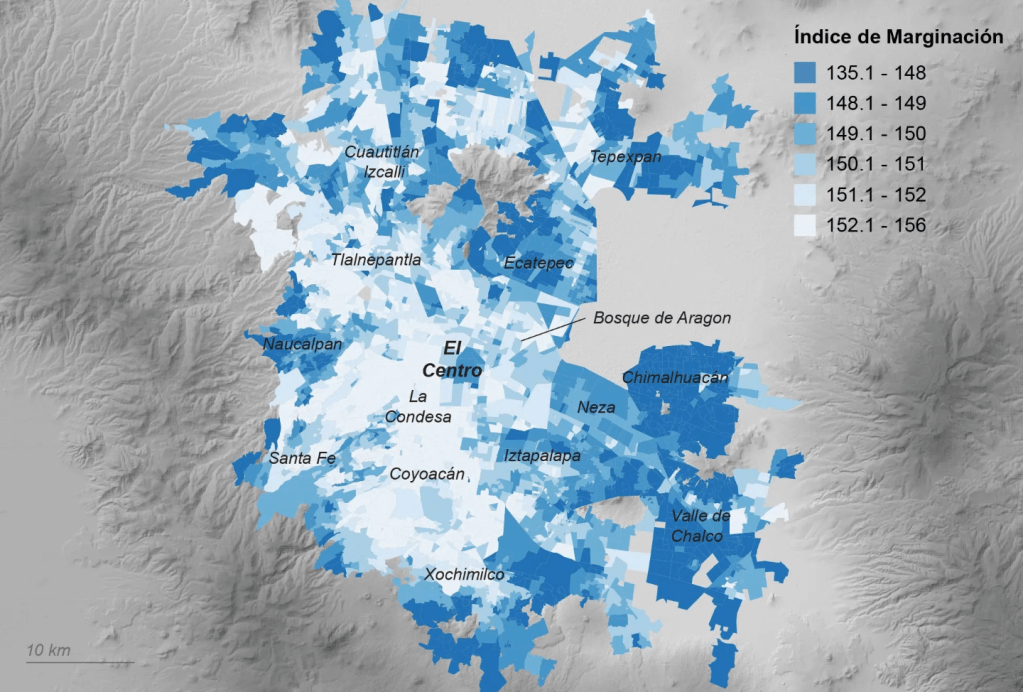
It could also be related to income differences. It’s possible higher income residents have gravitated towards the more verdant west side of CDMX. There could also be more investment put into planting, maintaining, and watering trees in wealthier neighborhoods or municipalities. Here is a map of the government’s Marginalization index, which is a score based on education, housing, income, and other sociodemographic factors. It almost looks like a mirror image to the map of trees coverage, with marginalization much higher in the east.
Regardless of why this is the case, poorer neighborhoods are clearly bearing the burden of the high heat and health impacts that come with lack of tree cover. This became much more apparent in Spring of 2023 when a months long, record breaking heat wave hit on the city. Below is map of surface temperatures on July 10, 2020 as measured by the USGS Landsat Mission.
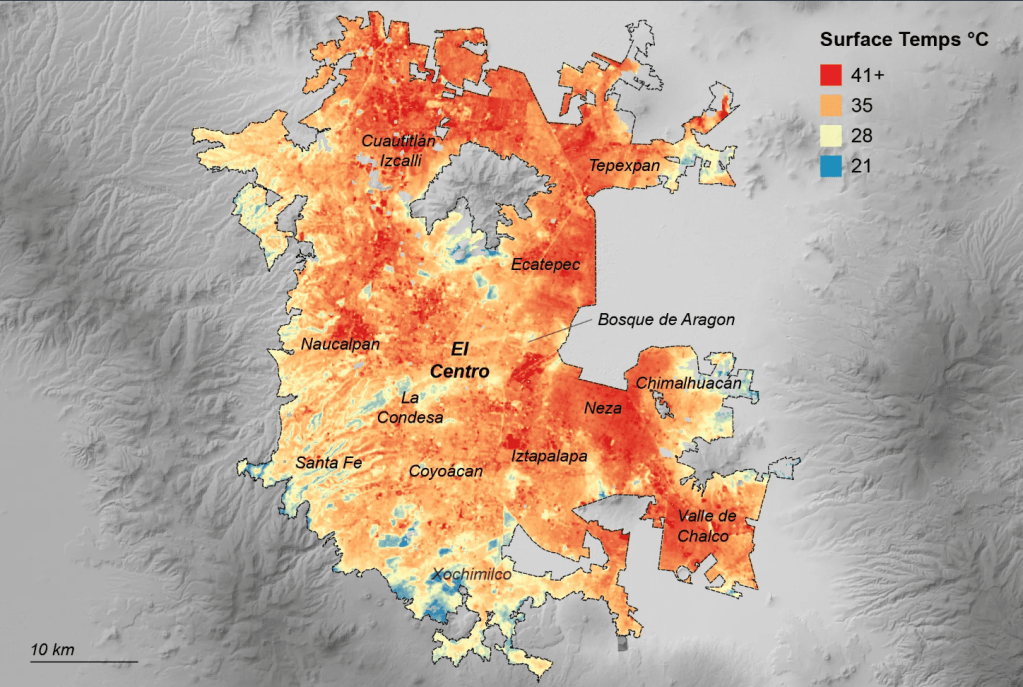
Surface temperatures are an important driver of urban heat island effect. Parks and tree-lined boulevards show up as yellow or blue, because of evapotranspiration and the shading that trees provide. Neighborhoods with few trees show up as solid orange as a result of materials like asphalt and concrete that heat up when the absorb sunlight. The heat in these materials is then emitted as longwave radiation, heating up the surrounding air.
So how can we create a map that identifies the neighborhoods most in need of tree planting?
I decided to keep it simple and focus on 2 factors, the places with the highest surface temperatures and the most marginalized communities. Marginalized communities often lack the capacity to cope with higher heat. To capture both factors, I created a bivariate choropleth map, where darker areas represent the places in highest need, because they are hotter and more marginalized. Preparing this map required layering and modifying the data: First, I found the mean temperature in each of the hex bins. Then, I joined the a marginalization score to the hex bins using the bin’s centroid. While this centroid-based approach may miss some details of the marginalization layer, it was sufficient for the purposes of this analysis.
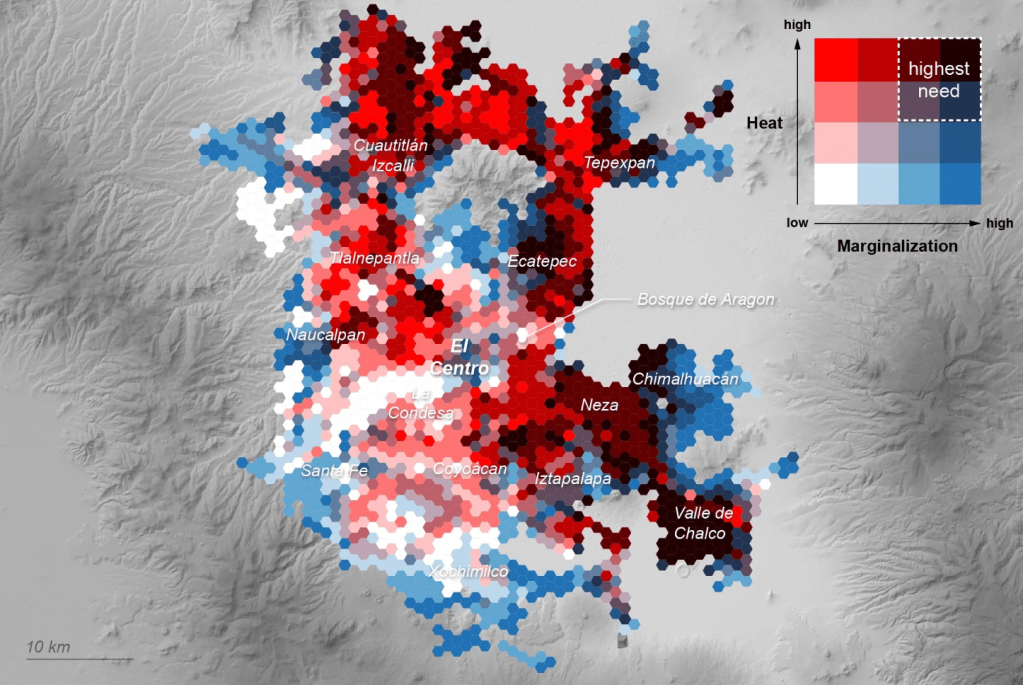
The result is a guide that can help Foresta plan and target tree planting programs in the city. With limited resources to plant new trees, Foresta can target the areas labeled as “highest need”. This map, combined with insights from the other maps, also presents some opportunities. For instance, Naucalpan is labeled as high need, but it’s located in one of the most humid parts of the city. Also, Bosque de Aragon demonstrates how lower surface temperatures can be achieved in the semi-arid east of the city.
This project exemplifies the transformative potential of an open data ecosystem for smaller, resource-constrained non-profits. By leveraging shared data, Foresta can achieve insights and make data-driven decisions that are often only feasible for well-funded organizations like Meta or national governments. These larger entities, equipped with better resources, have the opportunity to create value through open data programs. When data is open and collaborative, the impact ripples out beyond well-funded institutions, giving rise to a more inclusive model of innovation and allowing non-profits, like Foresta, to reach underserved communities and enhance our built environment. Ultimately, the project underscores the critical need for open data ecosystems in democratizing knowledge and enabling meaningful action across organizations of all sizes.
Curious about the author? Take a look at Meli´s portfolio! And if you want to dive into more articles like this one, don’t miss her blog.
Offset Flow
Carbon Credits & Net-Zero. TOGETHER.


Leave a comment